GradCafe is a site that allows graduate school applicants to share their results and questions regarding their applications. The site acts like a forum for students to interact, but, perhaps more importantly, it also indirectly or directly gathers a lot of data.
Previous analysis have been done using GradCafe data. I am standing on the shoulders of these giants:
I will not be repeating those same analyses. However, some results might be confirmed by my own analysis. The main focus however of this post is to answer some commonly asked questions regarding graduate admissions, GRE scores, GPA, international vs national status, etc.
Plus, it’s been 5 years since Debarghya’s analysis, so this analysis is probably worth it if only just to double check if some conclusions still hold.
Some Disclaimers
I wouldn’t be able to sleep at night without adding some huge disclaimers to this post so here you go. The results and entries presented and analyzed here are probably the very definition of selection bias. Here are some possible issues with data:
The overall population on the site is comprised of probably the more dedicated applicants
Applicants are more likely to post their results if accepted
Applicants with better stats are more likely to include them overall
Applicants might feel pressured into padding their stats when reporting them
Applicants with good stats but that got rejected are probably more likely to include their stats than rejects with not-so-great stats
Applicants might take the GRE multiple times and include only their best score when submitting applications and reporting to GradCafe
How I Obtained the Data
I scraped the data using code available on GitHub that’s largely based on Debarghya Das’s code. However, I adapted it for python 3 and added some usability extras so that anyone can download the data they feel they need and can stay up to date without relying on me or anyone to upload a new database of GradCafe entries. Additionally, I made it so the requests be made asynchronously and thus the scraping happens at a faster rate.
Queries to use to gather as much data as possible
Deedy mentions in his article about using the following query to gather his data:
u*
This query yields around 500,000 results at the time of writing. I, however, found that the following query yields more results at the cost of being a lot slower to process by the site.
(a*|e*|i*|o*|u*)
This query yields 650,000+ results.
It was this query alone that made me implemente the async fetching and scraping of data. Sometimes GradCafe won’t be able to handle all the requests and might just 504 on you. Retrying might solve the issue.
Overall GradCafe Statistics
The basic stats:
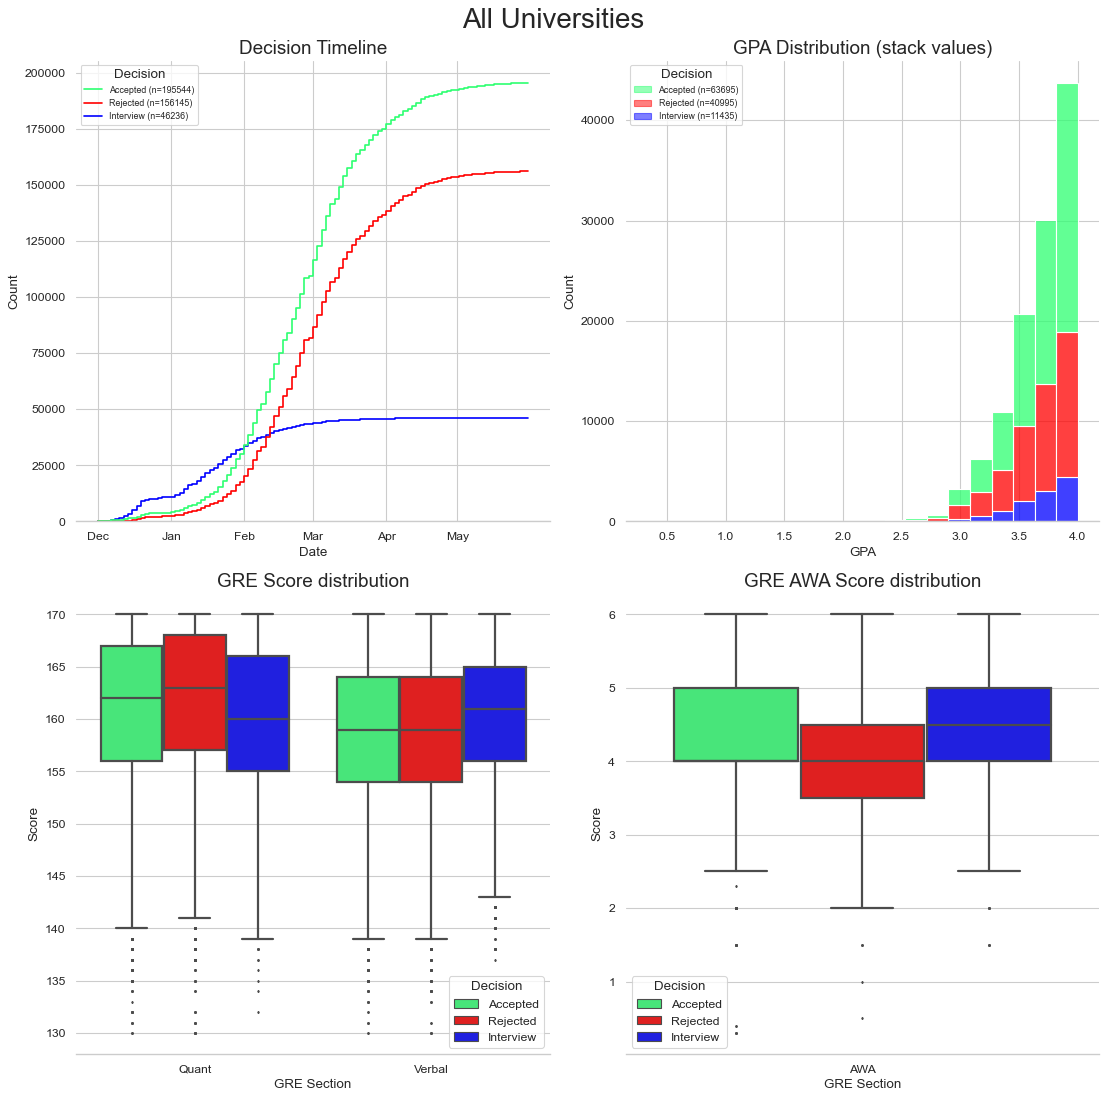
Fig. 1: Stats generated using all submissions for all institutions
GRE Stats
ETS presents the following data for the GRE:
Test
\(N\)
\(\mu\)
\(\sigma\)
Verbal reasoning
1,640,350
150.37
8.49
Quantitative reasoning
1,643,587
153.39
9.35
Analytical writing
1,635,221
3.58
0.85
These numbers do not align with the GRE stats gathered from GradCafe. This suggegsts that the biases I pointed out earlier do apply. However, these are the people who you’ll be competing with, if you’re applying at top programs or applying for fellowships, or if you’re applying for scholarships. These are the more relevant stats for the more serious applicants, i.e. you, you reading this post.
GPA Stats
While we don’t have good stats for GPA, a source like USNews claims that 2.0 should be an absolute minimum GPA to maintain. It’s quite staggering how the GPA distribution for GradCafe users is so top heavy, even though grade inflation has been a clear phenomenon in the US. Or is it?
Questions to be Answered
Do submissions on GradCafe reflect GPA inflation over the years?
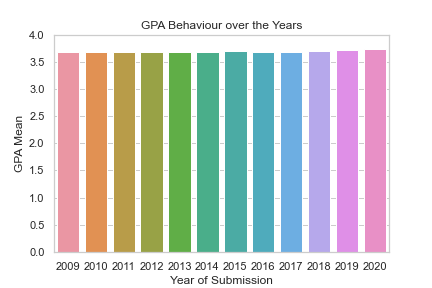
I personally don’t know much about this subject, but apparently some universities have been taking measures against the grade inflation problem. GradCafe data seems to go against the common assumption that grade inflation is still a problem. Fig 2 shows how the average GPA for applicants has remained stable for the past 10+ years.
Fig. 2: GPA average across all fields over the years
However, it may just be that top applicants, i.e. GradCafe users and maybe even you, reading this post, aren’t too affected by the grade inflation problem as they may be perfectly capable of achieving top-notch grades without any extrinsical help.
Do international students have significantly different stats?
There’s always the question of whether international applicants are held to different standards. Deddy entertained this idea in his blog post and here I am just trying to replicate results.
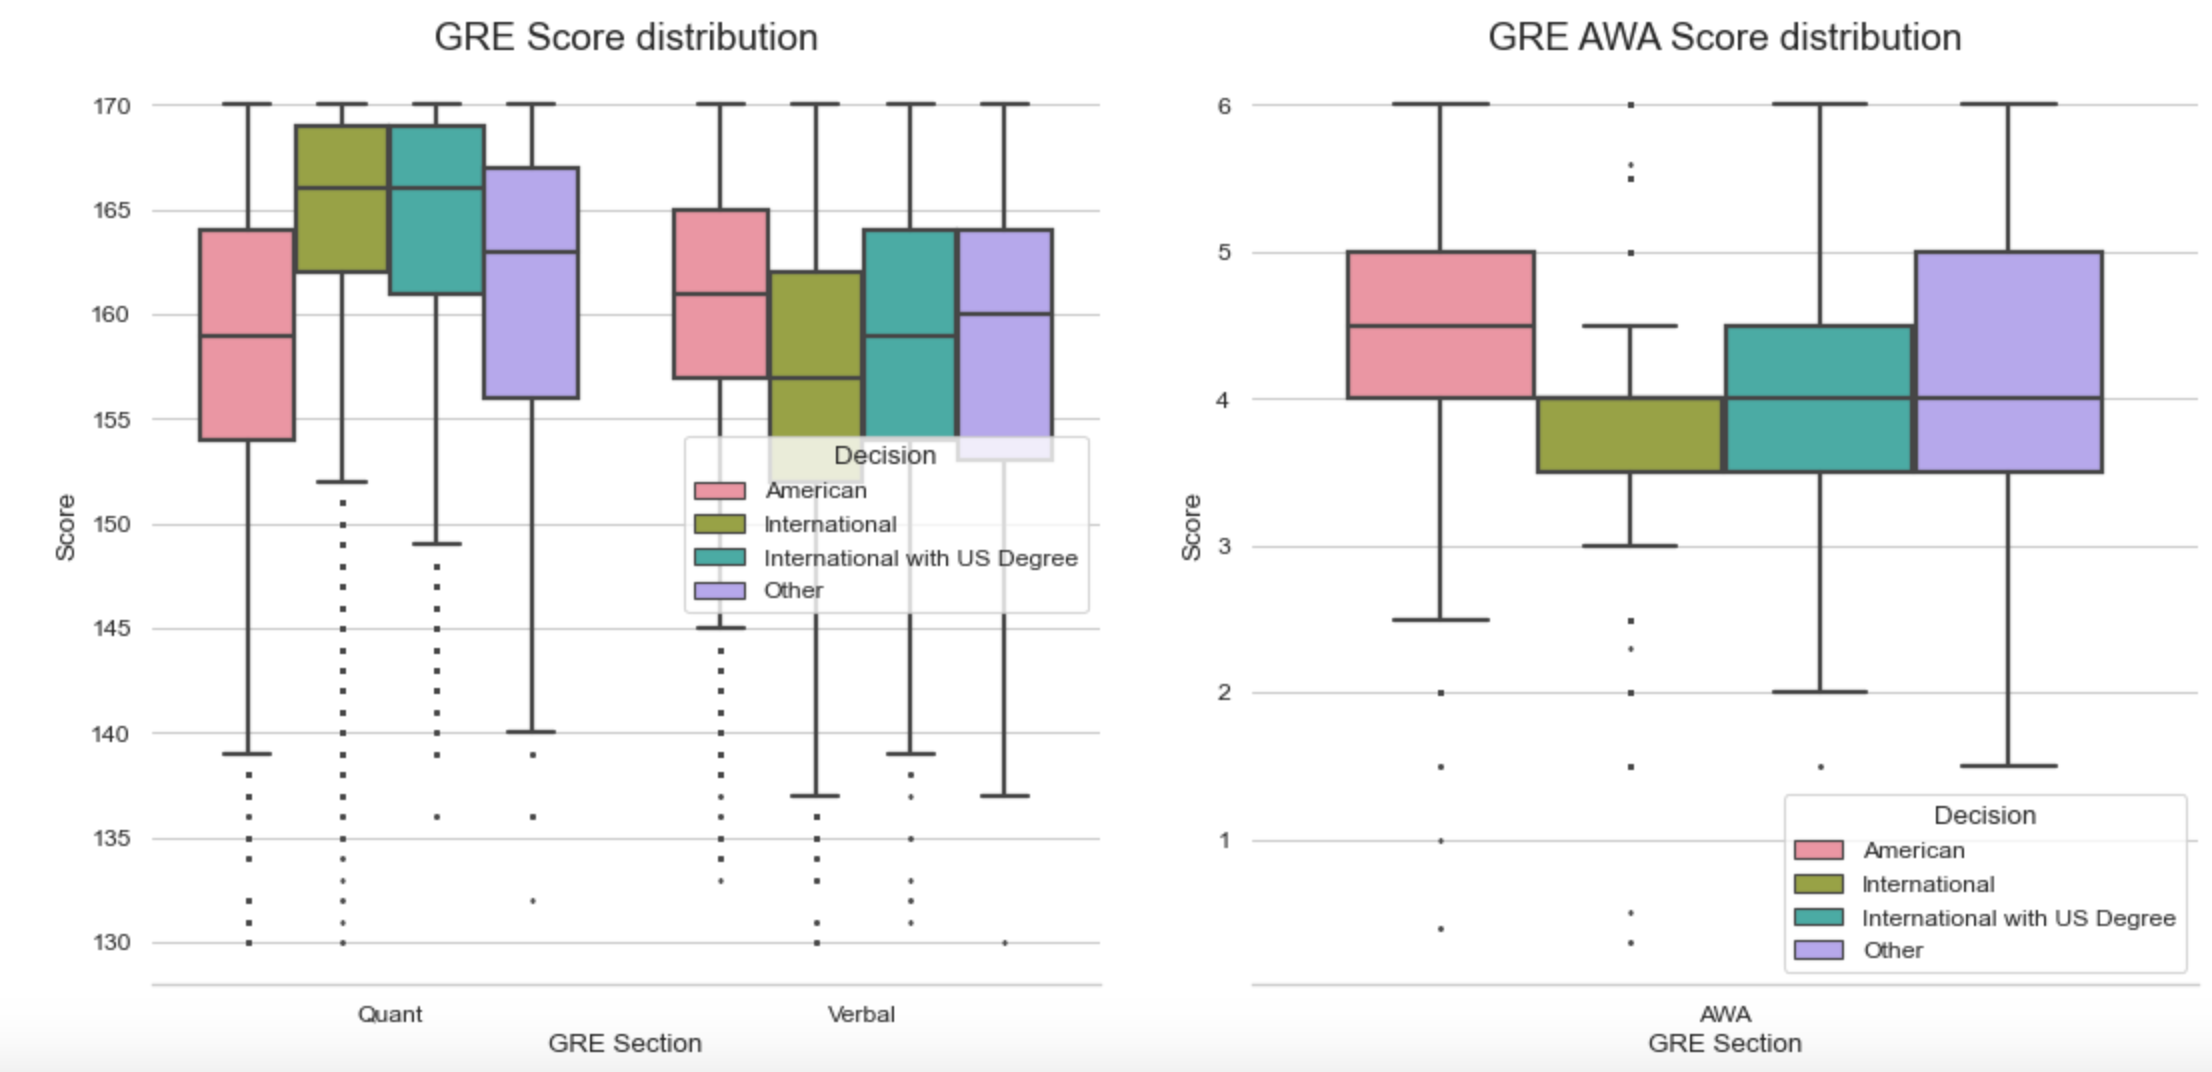
Fig. 3: GRE distribution according to status
When it comes to the GRE, Fig. 3 shows how international students, on average and across every field, seem to do slightly better than American students in the Quantitative section of the GRE. However, they do worse on the Verbal and Analytical Writing sections.
How each section is weighted probably heavily depends on the field of study and so it’s hard to measure if GRE standards are actually different for international students. These stats suggest that such discrepancy is not the case.
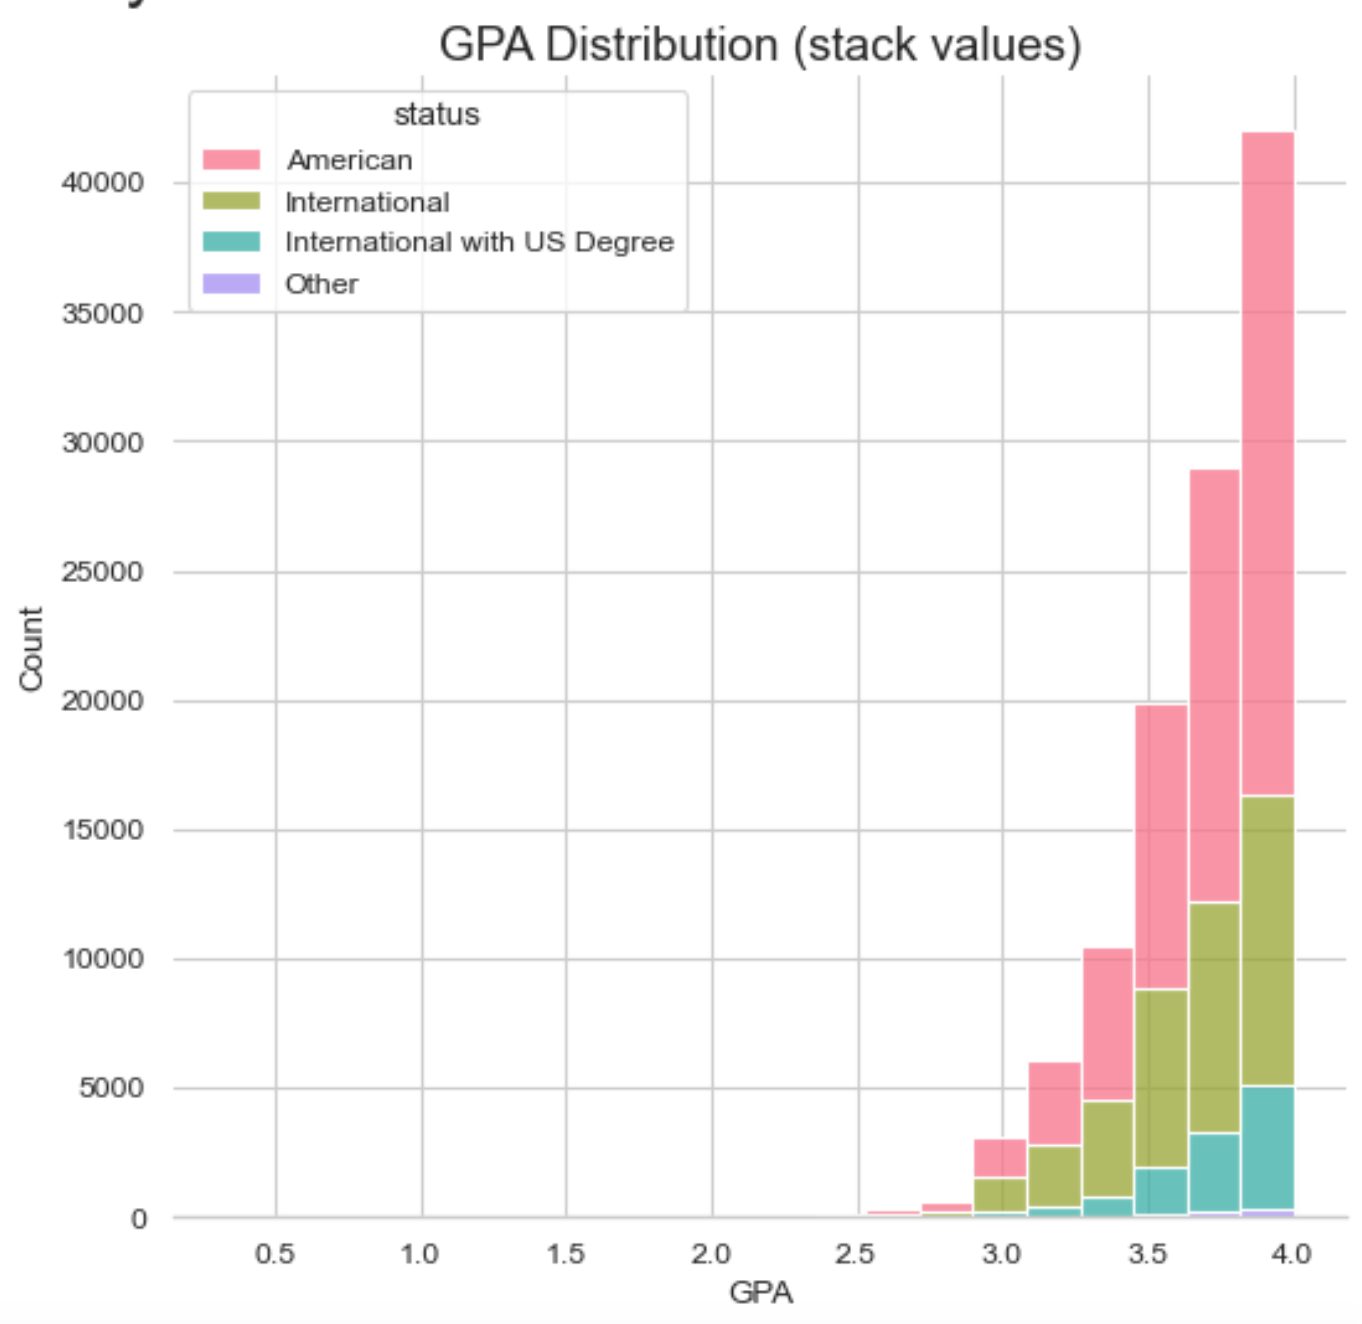
Fig. 4: GPA distribution according to status
When it comes to GPA, things are slightly fuzzier. Fig. 4 shows how American applicants are more top heavy when it comes to GPA. On the other hand, the distribution for international students seems more evened out. Different standards for GPA in different countries and different institutions probably explain this. It would not be out of the norm to have e.g. a 3.0 GPA in a particular school and still be a top 10% student.
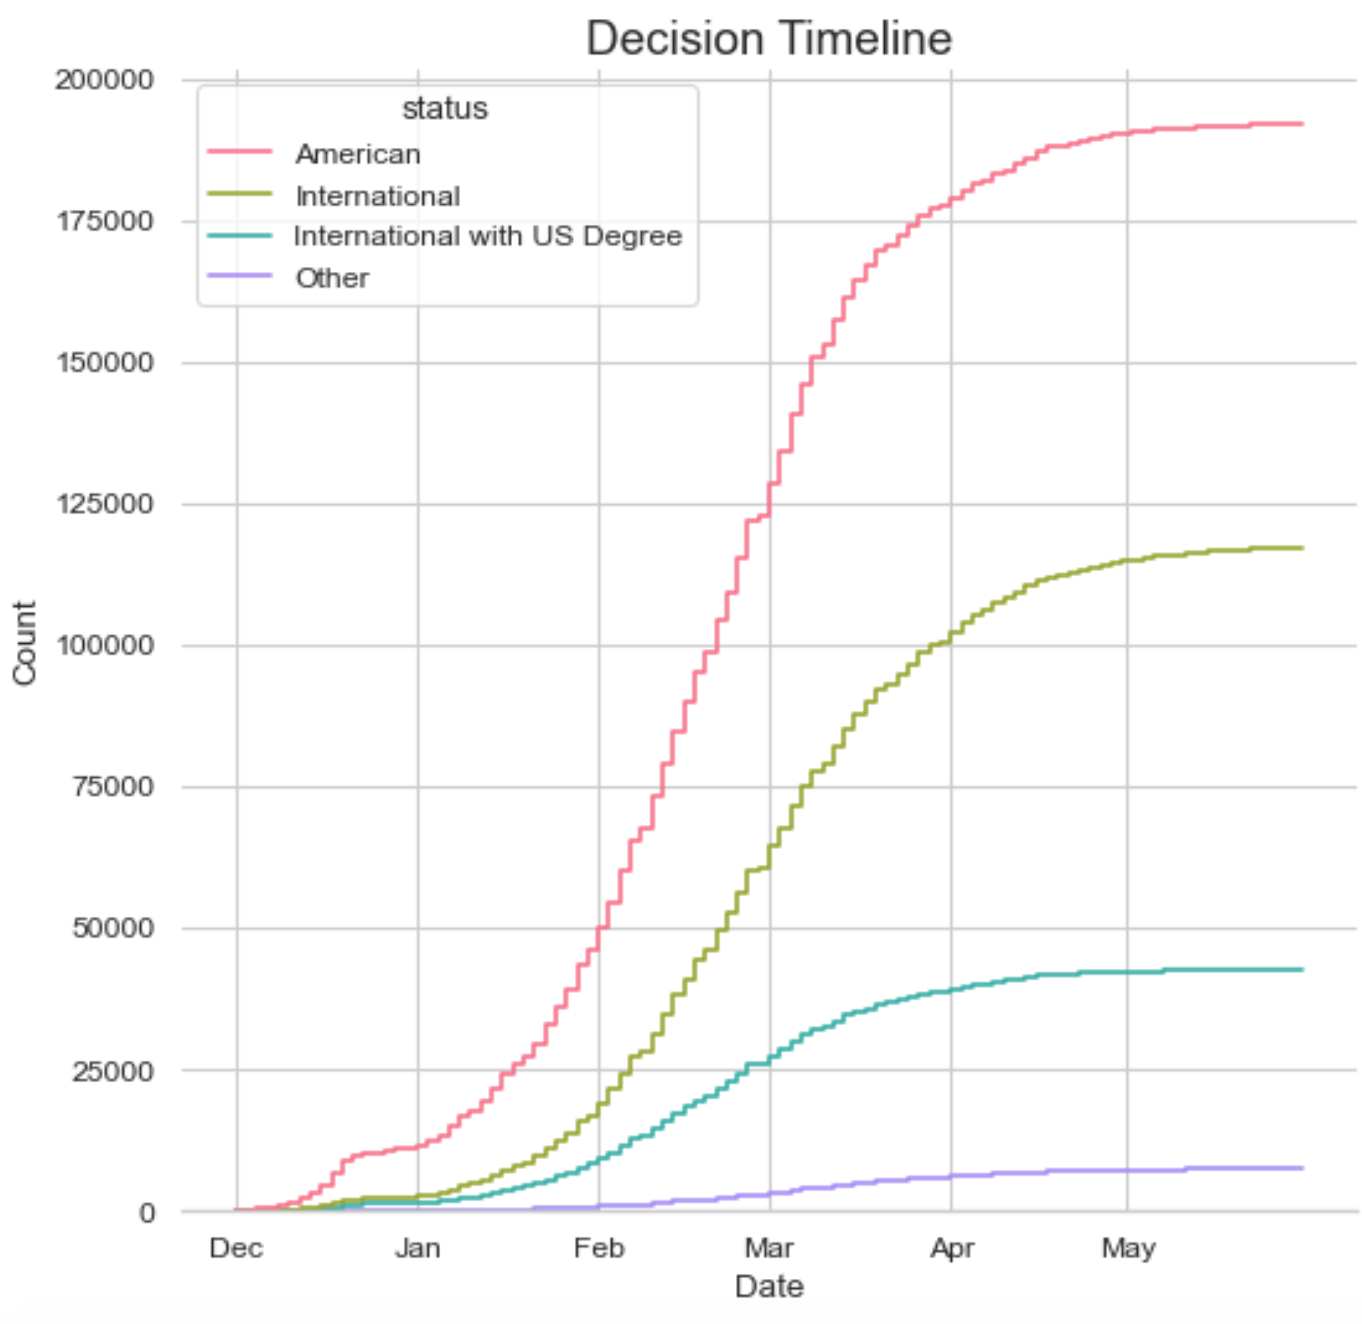
When should you expect a response? Are international applicants contacted later?
Fig. 5: Timeline behavior according to status
Fig. 5 suggests that both international and American students should be receiving news around roughly the same time. Does this vary by field though? I encourage people to explore this further, but as it stands, international applications being processed after national applications seems like a myth.
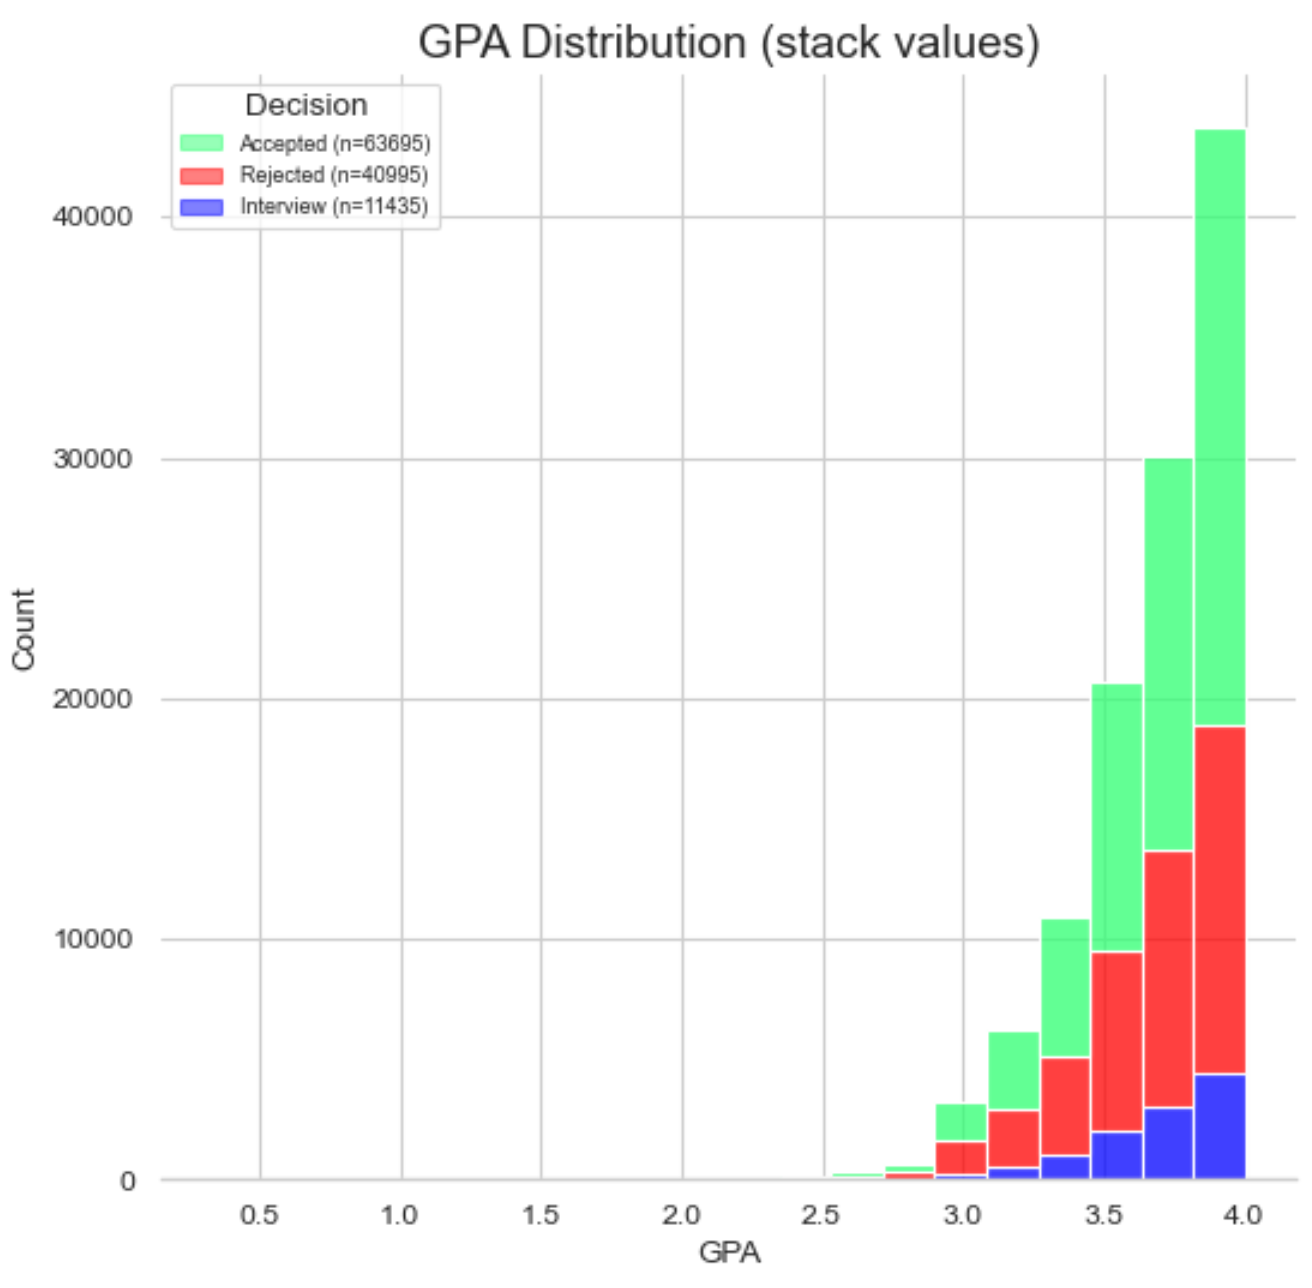
How much does GPA matter?
Fig. 6: GPA stats generated using all submissions for all institutions
Fig. 6 certainly makes me feel like it does. GPA might just be an indicator of how good the rest of the application package is. Anything under 4.0 seems to be completely split between getting accepted and rejected, so there must be more to applications than just GPA (or GRE for that matter).
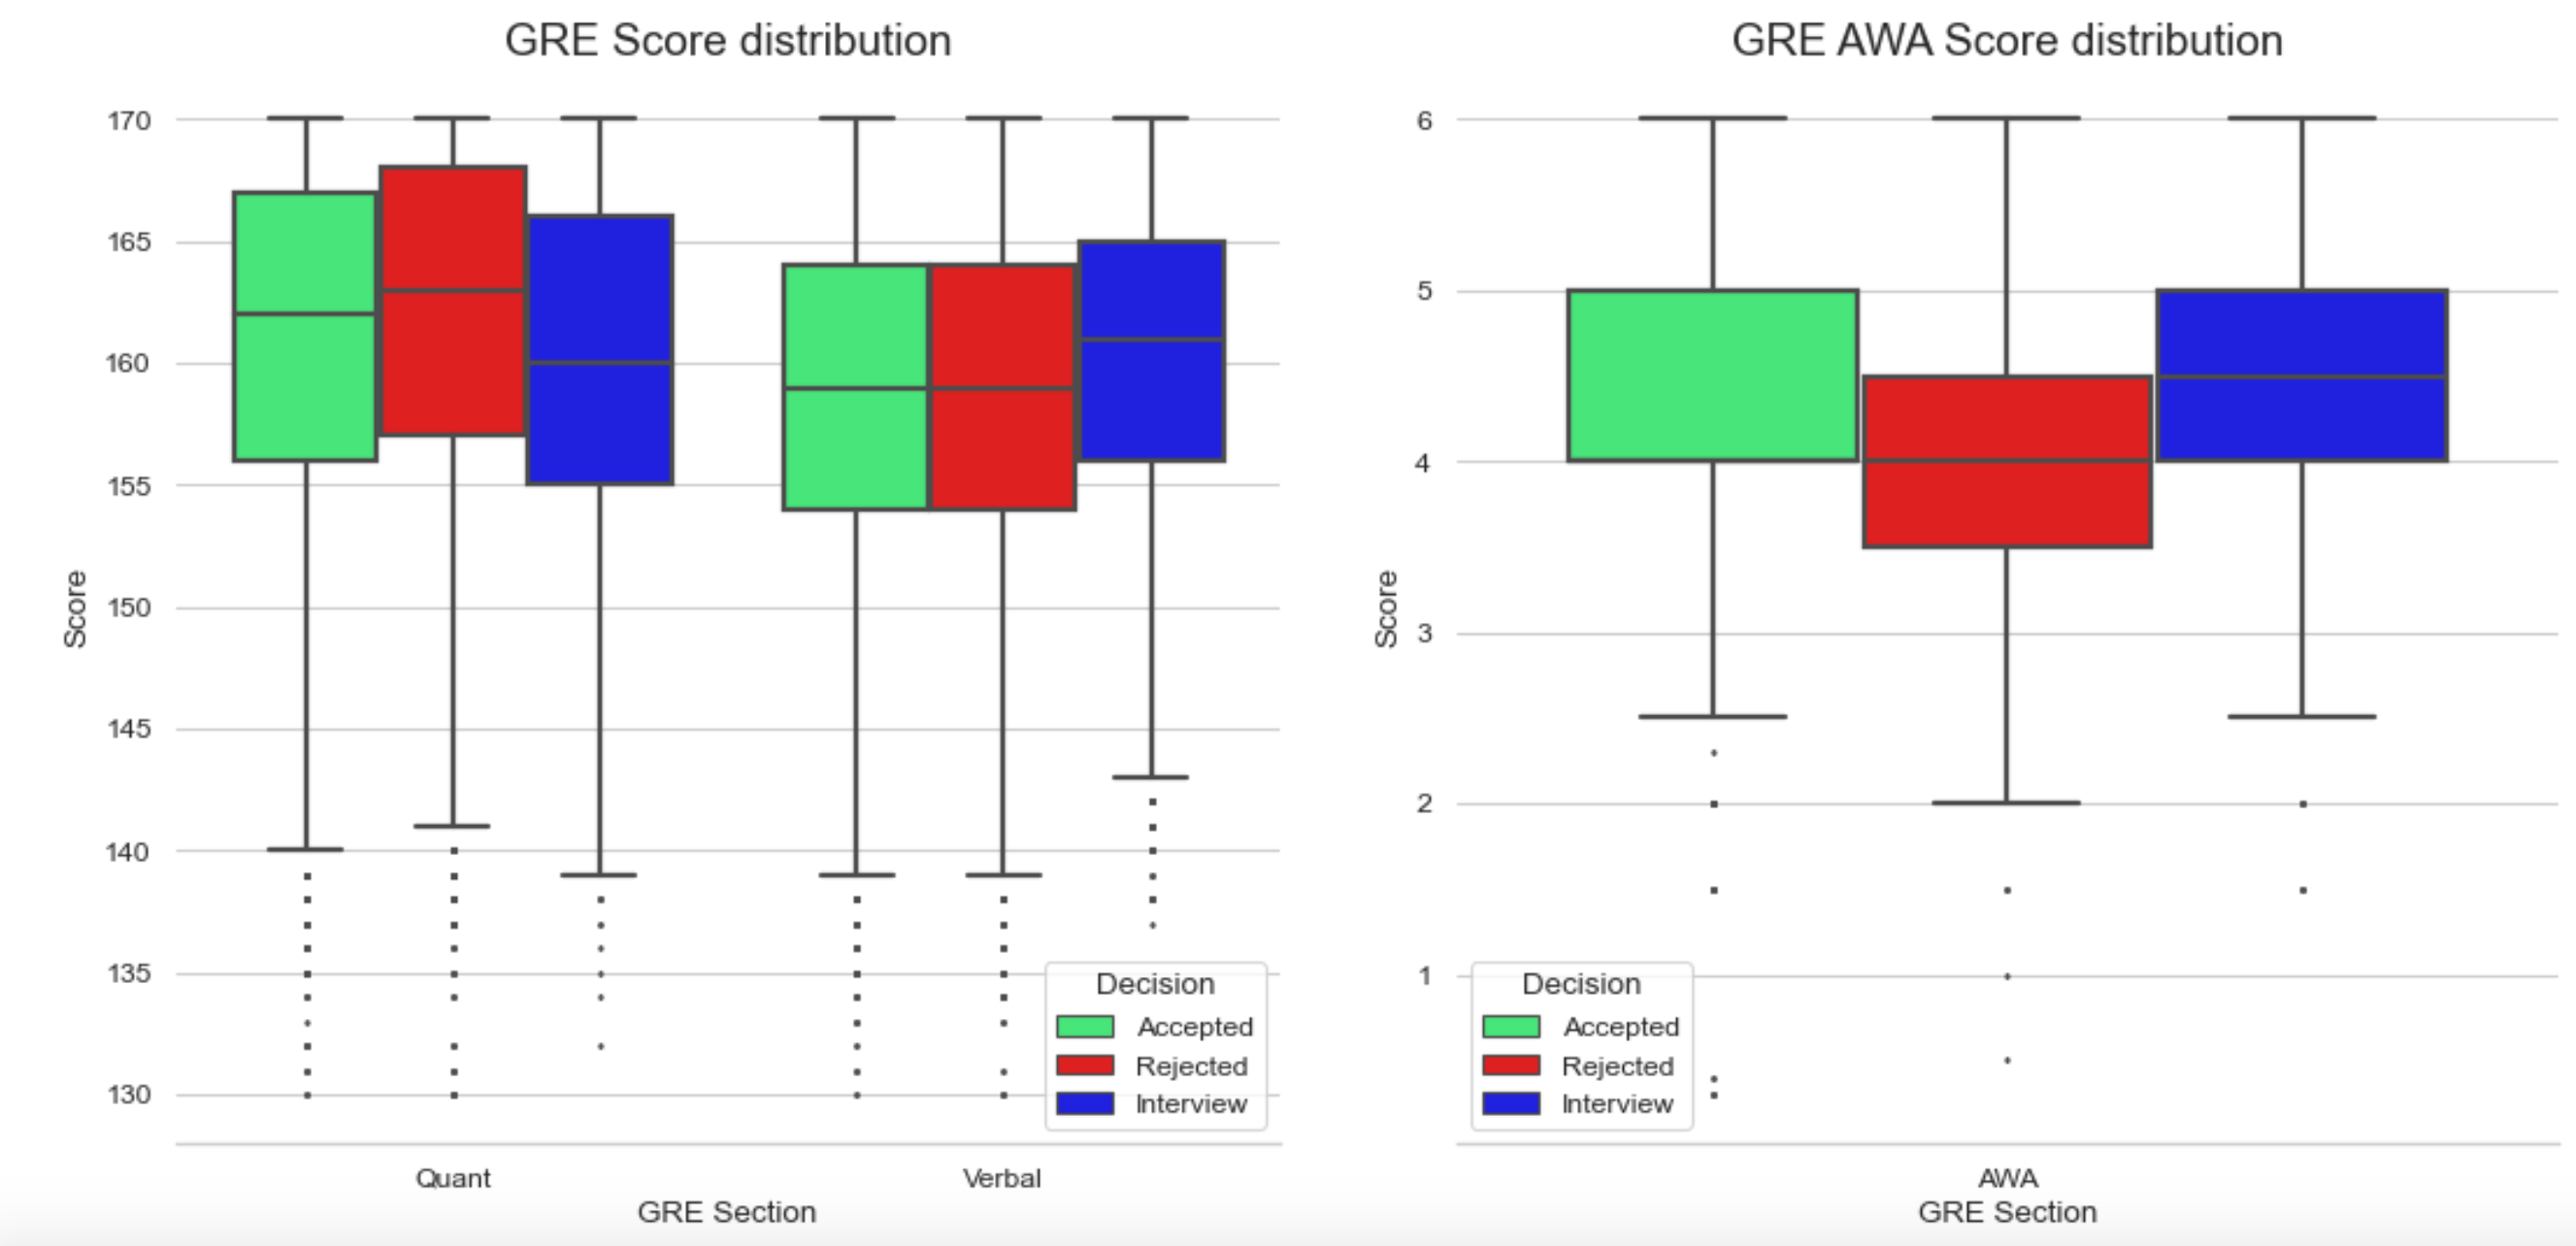
How much do the GREs matter?
Fig. 7: GRE stats generated using all submissions for all institutions
The only section of the GRE that could possibly be a predictor according to this data might be the Analytical Writing section. While this section is the one I personally respect more out of the whole test, it’s often the most ignored section in my experience.
The reason for that 0.5 difference being so significant, in my opinion, comes from the fact that percentiles for the two scores are vastly different, as opposed to e.g. a difference of one or two points in the Verbal or Quantitative sections.
Final notes
This is by all imaginable metrics bad statistics. It’s however more than we had before when it comes to actual graduate admissions data. Some of this analysis confirms what Deedy’s analysis was over 5 years ago.
We analyzed over 600,000 entries to GradCafe and while this sample is probably biased incredibly and even might include some troll posts, it’s probably reliable enough to arrive at some answers.
Distributions shown here probably vary a lot by field, and I can only encourage people to explore how their field behaves further.
Finally, several threads and comments by grad admissions committee members have come out pretty much outright stating that research experience and LORs are pretty much the most important aspects of your application once you’re past the GPA and GRE filters. This analysis seems to agree with the notion that once you’re past a certain threshold those non-measureable aspects come into play. Maybe in the future it’d be worth it to analyze the comment section of GradCafe where applicants usually include their research experience and LOR information.
I will be updating this post with stats and answers to those questions. I will also be adding most posts with more questions to be answered.
When I set up this blog to have support for \(\LaTeX\) support, I was guilty of not really understanding what was going on. I basically only knew that GitHub’s default math engine was MathJax, and that if I wanted to use \(\KaTeX\) I was gonna have to write a script that parsed the intermediate representation by getting rid of the script tags of type math/tex.
Recently kramdown got updated and the output for MathJax changed and the intermediate representation changed, the math/tex tags are no longer there. Which for me, it means that \(\LaTeX\) support was broken.
How to Fix KaTeX After the Kramdown Update
I Google’d how to get around this new update and found this blog entry. The idea of rendering \(\TeX\) code server side was exciting and felt more robust. However, that did not end up working. I figured this time I would learn how exactly how GitHub pages work when it comes to additional Gems needed. And turns out, I learned quite a bit.
Basically, GitHub pages is limited when it comes to using additional Gems (which are needed for sever-side rendering), and not only that, specifically, GitHub pages limits its math engine to only mathjax, in fact, they override whatever setting you choose. They force it to be mathjax. So server-side rendering is out.
The Fix
The only option is going back to client-side rendering. Luckily, \(\KaTeX\) has our backs with the autorender extension.
You basically just let mathjax process your markdown files with \(\TeX\) code in it. The intermediate representation rendered by mathjax is compatible with the aforementioned extension. Javascript and \(\KaTeX\) take care of the rest by simply using the following:
You can obviously choose when renderMathInElement is run. You can even choose not to add the code above whenever a post on your Jekyll blog doesn’t have math/formulas in it.
Additionally, you can write out the code yourself and not let mathjax process it for you.
Remember, your _config.yml file should not change the math_engine field.
Sometimes the simplest answer isn’t a trap answer at all and turns out to be the right answer. Who knew Occam’s Razor could apply to GRE problems, especially quant problems.
The example problem
At a certain graduate program, students can major in business, law, or both. If 60% major in law; 50% in business; and 10% are currently undecided, what is maximum percentage of students who can major in only business?
10
20
30
40
60
Give yourself around 60 seconds to try and answer the question. Also, if someone has a source for this question please let me know so I can credit accordingly.
Now, thanks to my introduction, some of you probably picked 40 without really thinking about it much. 40 is indeed the correct answer. Let’s solve this how most people would go about it:
Since
\[0.6 + 0.5 + 0.1 > 1\]
there must be some overlap, and since
\[0.6 + 0.5 + 0.1 = 1.2\]
The overlap between people who majored in law and people who majored in business must be 20%. That means that 30% are majoring in only business. If you stop here, you’re gonna end up choosing 30% as your answer, this is wrong. How do you maximize the number of people who are majoring in only business (remember, they’re asking you what’s the maximum number of people in only tha major? You have to make it so every undecided person picks only business as their major. This leaves you with 30% plus the now 10% of business majors. So you arrive to 40%.
I’m sure people have managed to make it even more complicated to solve a problem like this somehow, but we’re gonna be seeing an even simpler way of solving this problem now:
60% of people are majoring in law and thus can’t be part of the percentage of the final answer. 60% is out. You don’t care about that 60% anymore.
40% is what’s left. That’s it you’re done. Every undecided student majors in business and whatever quantity of students majoring solely in business is redundant at this point. You just know both sets add up to 40%, there’s no other choice.
Answer is 40%.
You don’t have to care about the overlap. You don’t even really need to care about the 10% of students who are undecided. You just know that 60% of students are definitely out, they already gave you the answer.
This question can be answered in 10 seconds and you don’t need to do (basically) any math at all. This is all the math you need to know:
\[100 - 60 = 40\]
When taking the real GRE you have to be on the lookout for this kinda way of thinking. Some problems will demand a lot more time than the standard 1 min 45s and so finding these shortcuts or efficient ways to go about solving problems are extremely valuable.
What is \(\pi\)? Yes, I know it’s \(3.14159 \ldots\). But what does it represent? What’s the concept behind the number and why is it so useful? If you know the answer to these questions, you may very well be able to abuse the concept of \(\pi\) and solve the following question in under 5 seconds:
Quantitative Comparison
A: The diameter of a circle A
B: An arch segment of circle A with a central angle of 120°
What’s bigger? Are they the same? Or is it simply impossible to tell?
I have simplified a GRE question in order to illustrate the power of understanding exactly what \(\pi\) is.
\(\pi\) simply represents how many times the diameter of a circle fits into its own circumference. That is, a circle can fit its diameter \(3.14159\) times into its circumference.
Now that you know the concept behind \(\pi\), you should be able to answer the question I presented above.
The answer is of course, B. The arch from option B can only fit in the circumference 3 times. Meanwhile, the diameter can fit \(\pi\) times. The arch can fit less times than the diameter, so it must be longer.
Now, you could probably solve this question picking a radius for the circle, calculating the length the circumference of the circle and then comparing both quantities, but by simply knowing what \(\pi\) represents, you can solve this problem in under 10 seconds. Now, granted, the original problem had some extra nuance, but it boiled down to exactly this same problem. Solve time for the original problem would only go up by a few seconds.
On the GRE, time is just precious, and having a good grasp of basic concepts can go a long way.
Now, if you think about it, you didn’t really do any math to solve this problem, if you just use the concepts approach. That’s the beauty of it. It’s way more efficient; you get to save time and energy. I really encourage people to try to tackle as many questions as possible using only concepts.
I’ve been done with my undergrad for a while now, and I’ve been looking at going to grad school. The general GRE is something I didn’t even know existed back in late November (3 months ago). However, I managed to get a 335 (out of 340) when I took the test in late January. Now, how did I do that? I will share some of my thoughts in this post and hopefully, they will be of help to someone out there. I also plan to write more about the GRE in general, since I am still learning more about it to this day and, even though, I don’t plan on retaking it, I’m still gonna be expose myself to resources regarding the test.
First of all, the GRE tests for three specific things (one of them isn’t reflected in the 335 I mentioned earlier). It claims to test your quantitative skills, that is to say math; it tests your verbal skills, that is to say your (English) language skills; and, finally, it tests your writing and analytical skills. The quant and verbal sections are graded on a scale from 130 to 170 and the analytical writing section is graded on a scale from 0 to 6.0. Since a lot of schools mainly care about the quant and verbal sections, most people only really mention the sum of the scores they get on those two sections. I, personally, got a 167 on the verbal section, a 168 on the quant section and a 5.0 on the analytical writing section. All of these scores belong to the 90th+ percentile and cumulatively they’re around 99th percentile scores.
As for how I approached my studying, because this test does require some studying or, rather, practice, I merely took a few practice tests, drilled some vocabulary words, and drilled some practice exercise sets. Now, this sounds very simple (and it is) but you can’t just go ahead and pick any type of material and just solve all the problems you’re presented with. You have to pick the right kind of material. This will, almost invariably, be ETS material. I was lucky to have found out about gregmat and his stuff was just instrumental for me to get the score that I did. His no-BS approach helped me get on the right track from the get-go and not lose any time using materials from third-party companies (which I’m not even gonna name).
I initially took the test after only taking a practice test (also by ETS) and I figured I would do alright since I’ve always been good at math and the verbal sections didn’t seem too rough either. That was a mistake, I simply wasn’t ready enough or acquainted enough with the test, the types of questions, the vocabulary, etc. I ended up getting a 158 for the quant and a 159 for the verbal which is honestly pretty average and realistically subpar if I wanted to apply to good CS grad programs. So here’s what I changed and how I approached my studying (or practice, whatever you wanna call them) sessions:
Quantitative
I quickly realized my geometry concepts were pretty rusty. The math that ETS tests you on is pretty basic, don’t think that your undergrad math courses are gonna be helping you out here. ETS tests you on high school only math. Easy math. Math I hadn’t given much thought in maybe a decade. So I grabbed myself the 5lb book by Manhattan (which is pretty much the only third party resource I’d recommend using) and did the problem sets on geometry. Since I was having problems with the arithmetic type of problems as well, I tackled those too.
Having an already good base knowledge allowed me to just focus on my weaknesses and focus I did. Once I was done with the 5lb book practice sets, I moved on to the official Quant practice book by ETS and solved the mixed problem sets on it. It only includes 3 of those, which is a shame. They are kinda tough so they will for sure help you out when prepping.
Verbal
If you’re like me, an educated English speaker (I’ll eventually write a blog post on why I consider myself to be a native English speaker), this section should not give you too much trouble. However, I did have to learn a lot of vocabulary. Since I’m not an avid reader, a lot of the vocab that shows up on the GRE was just completely foreign to me. I have some experience with language learning so I applied some of the concepts I’ve used to before in order to learn these new words. I knew spaced repetition was something I had to use, so I went ahead and downloaded Anki (flashcard sofwtare that handles the SRS aspect of learning by itself) and downloaded a deck of GRE words. This particular deck contained 569 words. Some of the cards in the deck were poorly designed, but overall the quality of the words, and by that I mean the likelihood of them appearing on the test, was pretty high.
Other than drilling vocab, I also learned some strategies from gregmat videos, the most useful one probably being the pairing strategy.
Finally, I also did one practice set from the official verbal practice book and that was that.
Analytical Writing
For this section I simply watched gregmat’s vids on the matter and practiced writing a few essays to get a feel for the timing and the structure of the essays. I did buy the e-grader service (Scoreitnow) which lets you simulate test day conditions and gives you an actual grade for your essay. This is a service provided by ETS and it lets you submit up to 6 or 8 essay responses. I only used up three, but I’m sure the other 3-5 are very useful if you need more time to get used to some specific aspect of this section.
Overall, I’m really happy with what I did. There are lots of things to unpack about the GRE and I have a lot of thoughts regarding the whole ordeal. I’ll eventually write posts on topics such as:
Good scores and how it’s all subjective
How CS programs seem to evaluate GRE results
Best way to approach certain types of problems
Random tricks and hacks that could prove useful on test day